Enhance presentations with powerful visuals
Simplify processes with a diagram. Summarize concepts with a graph. Engage your audience through videos or animations.
With Google Slides presentations, bring your ideas to life through professional and polished visuals—no software required.
What you need:
account_circle G Suite account
schedule 15 minutes

Add visuals
Images and videos capture and keep your audience’s attention. Graphs summarize complex information easily and quickly. Adding visuals is a quick and easy way to enhance presentations, and they’re built right in Slides.
In this section, you learn how to:
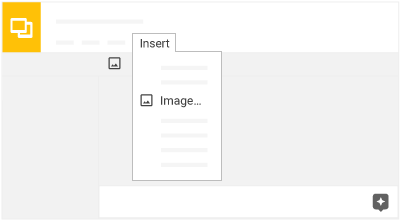
Add images
To add an image to your presentation in Slides, do one of the following options:
- Drag an image from your desktop into a slide.
- Click Add image image or select Insert > Image and choose where to get your image from. Double-click an image to add it.
- At the bottom of your presentation, click Explore assistant. Search for text related to the image you want. Click Images, then hover over an image and click Add add.
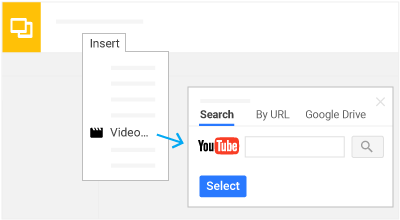
Add videos
Add a video to a slide:
- Click Insert > Video.
- Choose one of these options:
- On the Search tab, enter your search terms and click Search .
- On the By URL tab, enter the URL of the YouTube video.
- On the Google Drive tab, select My Drive, Shared with me, or Recent. Choose a video from the results that appear or enter your video details in the Drive search box.
- Click .
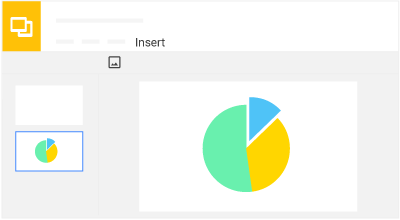
Add graphs
To add a bar graph, line graph, pie chart, or any other type of graph to a slide, save it as an image and then select Insert > Image.
To add a graph created in Sheets, just copy and paste it. You can change a graph or chart’s size, dimensions, and colors in Sheets and then copy and paste it again into your presentation.
Add transitions and animations
Transitions make moving from one slide to the next a little more interesting, by fading or sliding into the next slide. Animations make shapes, images, or text boxes dynamic—they can fade in or out, appear and disappear, or fly in and out with the click of a button.
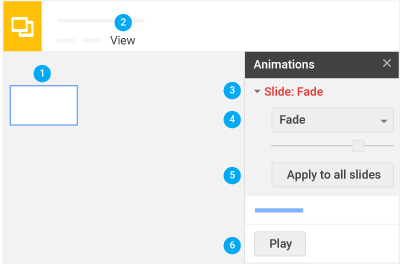
Add transitions to a slide or presentation:
- Select the slide you want to add a transition to.
- Select View > Animations.
- Click the arrow next to Slide.
- Select the type of transition.
- (Optional) To apply the transition to the entire presentation, click .
- (Optional) To test the transitions, click .
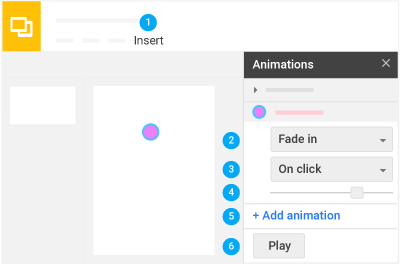
Animate text, images, or shapes in a slide:
- Select the object you want to animate and select Insert > Animation, or right-click the selected image, shape, or text box and select Animate.
- Select the type of animation.
- Select when to start the animation.
- Specify an animation speed.
- (Optional) To animate other objects on the same slide, select the object and click Add animation.
- (Optional) To test the animations, click .
Animations are played in the order they appear in the Animations pane. To change the order, drag an animation up or down in the list.
Edit visuals
After you add a visual, you might want to make further changes. With Slides, you can edit images without using any software.
In this section, you learn how to:
Crop images
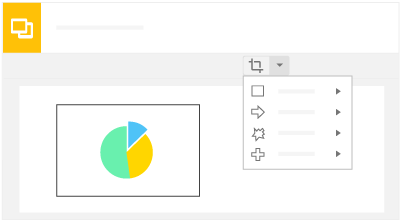
Crop an image in Slides:
- Click your image to select it.
- Do one of the following options:
- Click Crop crop, drag the box where you want it and press Enter.
- To crop your image into a shape, click the arrow next to Crop crop and select a shape.
To revert to the original image, select the image and click Reset image
 .
.
Add borders
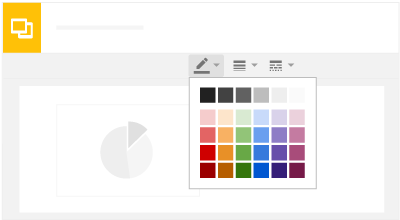
Add a border to an image, shape, or graph:
- Select your object and click Line color border_color.
- Choose a color for the border.
- (Optional) Click Line weight line_weight to adjust the border thickness.
- (Optional) Click Line dash line_style to change the border type.
To remove a border, click Line color border_color and select Transparent.
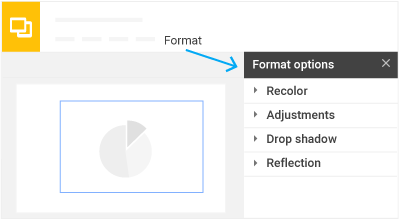
Adjust image color
Adjust the color of an image:
- Select the image and do one of the following options:
- Click More > .
- Go to Format > Format options.
- Choose a different color option.
- Adjust the transparency, brightness, or contrast.
- Add a drop shadow.
- Add a reflection.
Undo these changes:
Click Reset image .
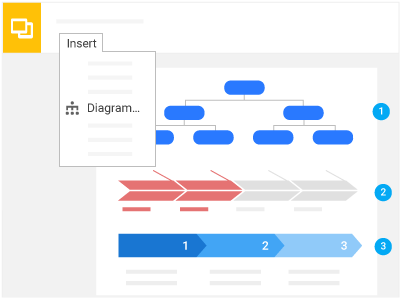
Create diagrams and flowcharts
Diagrams and flowcharts make complex processes in your presentation easier to understand. All you have to do is add, combine, and edit shapes—no diagram software required.
In this section, you learn how to:
Add shapes
To create a diagram or flowchart, you can add and combine different shapes.
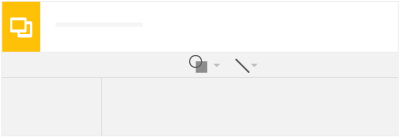
Add a shape:
- Click the slide where you want to add the diagram or flowchart.
- Add any combination of these shapes:
- To add a shape, click Shape and choose a
shape or arrow.
- To add connecting lines or arrows, click Line and choose a
line or arrow.
Edit shapes
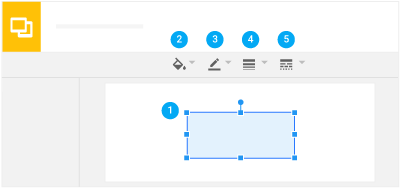
Click the shape you want to edit and do one of the following options:
- To resize a shape, drag one of the points on the shape.
- To change the shape color, click Fill color format_color_fill.
- To change the border color, click Line color border_color.
- To change the border width, click Line weight line_weight.
- To change the border type, click Line dash line_style.
Insert text
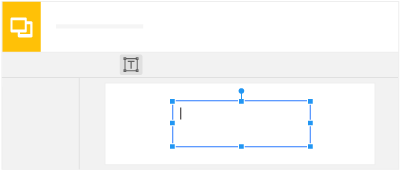
Insert text in a slide:
- Click Text box and drag a text
box on the slide.
- Click inside the box and type the text.
To insert text in a shape, double-click inside the shape and type the text.
Example diagrams
- Flow charts
- Cycles
- Processes